Skip to content

When you choose to publish with PLOS, your research makes an impact. Make your work accessible to all, without restrictions, and accelerate scientific discovery with options like preprints and published peer review that make your work more Open.

PLOS BLOGS All Models Are Wrong

Possible futures

This is the final part of a series of introductory posts about the principles of climate modelling. Others in the series: 1 | 2 | 3 | 4

The final big question in this series is:

How do we predict our future?

Everything I’ve discussed so far has been about how to describe the earth system with a computer model. How about us? We affect the earth. How do we predict what our political decisions will be? How much energy we’ll use, from which sources? How we’ll use the land? What new technologies will emerge?

We can’t, of course.

Instead we make climate predictions for a set of different possible futures. Different storylines we might face.

Here is a graph of past world population, and the United Nations predictions for the future using four possible fertility rates.

Data source: Population Division of the Department of Economic and Social Affairs of the United Nations Secretariat, World Population Prospects: The 2010 Revision

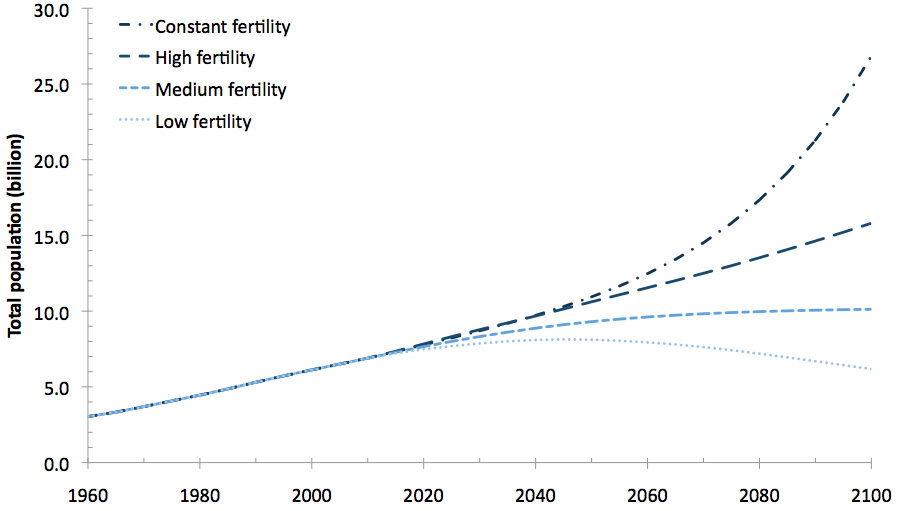
The United Nations aren’t trying to answer the question, “What will the world population be in the future?”. That depends on future fertility rates, which are impossible to predict. Instead they ask “What would the population be if fertility rates were to stay the same? Or decrease a little, or a lot?”

We do the same for climate change: not “How will the climate change?” but “How would the climate change if greenhouse gas emissions were to keep increasing in the same way? Or decrease a little, or a lot?” We make predictions for different scenarios.

Here is a set of scenarios for carbon dioxide (CO2) emissions. It also shows past emissions at the lefthand side.

Modified from Intergovernmental Panel on Climate Change, Fourth Assessment Report Working Group 1, Figure 10.26
Extracted from Intergovernmental Panel on Climate Change, Fourth Assessment Report Working Group 1 Figure 10.26

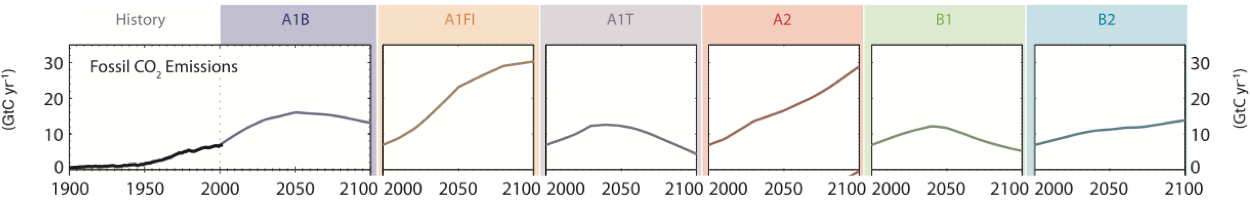
These scenarios are named “SRES” after the Special Report on Emissions Scenarios in 2000 that defined the stories behind them. For example, the A1 storyline is

“rapid and successful economic development, in which regional average income per capita converge – current distinctions between “poor” and “rich” countries eventually dissolve”,

and within it the A1F1 A1FI scenario is the most fossil-fuel intensive. The B1 storyline has

“a high level of environmental and social consciousness combined with a globally coherent approach to a more sustainable development”,

though it doesn’t include specific political action to reduce human-caused climate change. The scenarios describe CO2 and other greenhouse gases, and other industrial emissions (such as sulphur dioxide) that affect climate.

We make climate change predictions for each scenario; endings to each story. Here are the predictions of temperature.

Extracted from Intergovernmental Panel on Climate Change, Fourth Assessment Report Working Group 1, Figure 10.26
Extracted from Intergovernmental Panel on Climate Change, Fourth Assessment Report Working Group 1 Figure 10.26

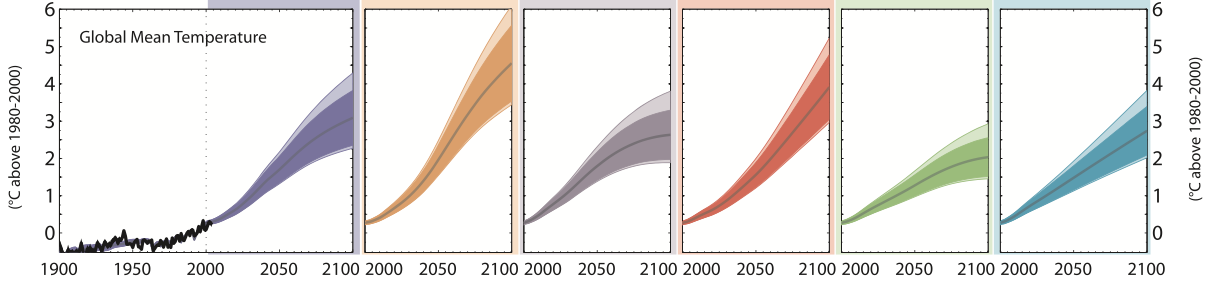
Each broad line is an estimate of a conditional probability: the probability of a temperature increase, given a particular scenario of emissions.

Often this kind of prediction is called a projection to mean it is a “what would happen if” not a “what will happen”. But people do use the two interchangeably, and trying to explain the difference is what got me called disingenuous and Clintonesque.

We make projections to help distinguish the effects of our possible choices. There is uncertainty about these effects, shown by the width of each line, so the projections can overlap. For example, the highest temperatures for the B1 storyline (environmental, sustainable) are not too different from the lowest temperatures for A1F1 A1FI (rapid development, fossil intensive). Our twin aims are to try to account for every uncertainty, and to try to reduce them, to make these projections the most reliable and useful they can be.

A brief aside: the approach to ‘possible futures’ is now changing. It’s a long and slightly tortuous chain to go from storyline to scenario, then to industrial emissions (the rate we put gases into the atmosphere), and on to atmospheric concentrations (the amount that stays in the atmosphere without being, for example, absorbed by the oceans or used by plants). So there has been a move to skip straight to the last step. SRES are being replaced with Representative Concentration Pathways (“RCP”).

The physicist Niels Bohr helpfully pointed out that

“Prediction is very difficult, especially if it’s about the future.”

And the ever-wise Douglas Adams added

“Trying to predict the future is a mug’s game.”

They’re right. Making predictions about what will happen to our planet is impossible. Making projections about what might happen, if we take different actions, is difficult, for all the reasons I’ve discussed in this series of posts. But I hope, as I said in the first, I’ve convinced you it is not an entirely crazy idea.


Discussion
  1. Is there not a danger of mistaking:

    ‘All’ possible futures that we can think of’, with

    ‘All possible futures that could actually occur’,

    because of missing information (something economists know full well) and not warning policymakers of this possibility?

    Hypothetically say, if in the next 2 decades, temps fell -0.1C per decade, or ONLY rose at 0.07C per decade, but emissions followed the high emissions scenarios.. this might be an example of this.

    (the Met Office current decadal forecast, actually has both scenarios in the range over the next half decade)

    we will see, but the theory cooling ocean phase might cause this the -ve rate, is getting more traction (and of course, warm ocean phase 80’s and 90’s may have had a bigger impact, on temp rises then – something Sir Brian Hoskins and Prof Myles Allan alluded to, when the Met Office released a new decadal forecast, showing a flatter rate of warming for the next 5 yrs or so, than the previous decadal forecast.

    But what if, under all scenarios the models are just to warm, (or too cold) and what should scientists say to policymakers, when observations seem to indicate those earlier projections are just unlikely now. The momentum towards policy based on earlier projections becomes a problem.. because they do not capture the full window of possibilities.

    Ie

    Under ALL scenarios, the world is projected to warm, by 1.2-1.5C by 2040 (Foresight report, above baseline average) and temps diverge after, but we are currently observing about 1/4 of the warming rate to actually achieving it, despite emission being on the high emission scenario path. and 2040 is less than 3 decades away.

    So an obvious question is when do the models project a higher rate of warming to restart, and what is the highest rate that the models allow?

    ie since Jan 1999 (A Met Office date) warming has been ~0.07C per decade, but we need to observe ~0.3C per decade (on average, or higher) to actually hit that lower boundary of temp projections by 2040, under ALL scenarios..

    And if the current decadal forecast is right until 2017 (flat’ish) then that rate would have to shoot up to 0.45C or higher, to meet those earlier projections by 2040 (under all emission scenarios.)

    So the question is just when do the models suggest a higher rate of temp rise will re-occur?

    For example, pre Copenhagen (2009), the Met Office discussed temps had been flat for a decade, (warming at the time, about 0.07C from Jan 1999) but expected warming to restart in the next few years, at a rate of 0.2c per decade, (for THIS DECADE) but he new decadal projection, replace this, and warming is set to be flat..

    So where does that leave the 2040 projections of temp, where policymakers are basing policy on.. At what point in time, are we able to establish whether projections are wrnog (or right).

    And I had a very long chat with Prof Richard Betts about this at the Met Office, as short version of events on video here (we agreed the cut)

    http://www.myclimateandme.com/2013/05/07/when-barry-met-richard-our-first-poll-winner-comes-to-the-met-office-2/#comments

    I could not quite pin Richard down to when models should show significant rate of warming again, we need ~0.3C, right now per decade to hit 2040 projections, but he did concede the 0.3C, vs the low rate observed. I was looking for a test, that either constrains OR validates the projections.

  2. My question was based on this (ie Met Office predicted 0.2C per decade THIS decade, and within the next few years- in 2009 and then increasing)

    This Met Office pre Cop15 press release was the same one, which received wide media attention, where some interpreted accelerating warming, because of Vicky Pope saying half of the next years will be the warmer than the warmest on record.

    [In 2009]
    However, the Met Office’s decadal forecast predicts renewed warming after 2010 with about half of the years to 2015 likely to be warmer globally than the current warmest year on record.

    http://www.metoffice.gov.uk/news/releases/archive/2009/global-warming

    [In 2009]
    The least squares trend for January 1999 to December 2008 calculated from the HadCRUT3
    dataset (Brohan et al. 2006) is +0.07±0.07°C decade much less than the 0.18°C decade recorded between 1979 and 2005 and the 0.2°C decade expected in the next decade (IPCC; Solomon et al. 2007).

    And:

    [in 2009]
    “Given the likelihood that internal variability contributed to the slowing of global temperature rise in the last decade, we expect that warming will resume in the next few years, consistent with predictions from near-term climate forecasts (Smith et al. 2007; Haines et al. 2009). ”

    http://www.metoffice.gov.uk/news/releases/archive/2009/global-warming

    Thus 0.3C (on average) has to start right now, for even the low end of the Foresight 2040 projections to be right (ish), as 2040 is less than 3 decades away, the longer the pause the higher the rate of average warming is required (>0.3C per decade)

    ie if the pause continued to 2020, the rate would need to be 0.45-0.6C per decade! (ish) which I don’t think is very plausible up to 3x the highest observed rate in 20th century.

    http://www.myclimateandme.com/2013/05/07/when-barry-met-richard-our-first-poll-winner-comes-to-the-met-office-2/#comments

  3. President: …but one day, if the progeny (of the civilized apes) turn out to be as nice as the parents — who knows? They might make a better job of it than we did

    Hasslein (Presidential Scientific Advisor): By destroying the world?

    President: Are you sure that what they saw destroyed was the world?

    Hasslein: Aren’t you?

    President: I consider it dispassionately as a possibility — not hysterically as a fact

    (from Escape from the Planet of the Apes)

  4. The words “projection”, “scenario” and “storyline” are euphemisms for what really are predictions. These euphemisms are used in case the analyst does not have sufficient time to do the work properly, in case the analyst has low confidence in her predictions, or in case the analyst prefers her work not to be scrutinized too much.

    In an incomplete model of an interconnected system, any prediction is, of course, a conditional prediction — a prediction conditional on the bits that are missing from the model.

    There are plenty of models that (conditionally) predict, in the proper sense of that word, political decisions, energy use, land use, and technological change. Some of these models are better than others. Most of these models are better than they used to be. (There are, after all, loads of data on these matters.) Few of these models are known, let alone used, in climate research.

  5. All predictions are conditional, regardless of the completeness of the model or the interconnectedness of the system. If I use simple physical laws to predict behaviour after application of a simple force that doesn’t mean I predict the same behaviour would also occur without that force. Thus, “conditional prediction” is meaningless: all predictions are made with certain circumstances in mind.

    Talking about “projections” is an acknowledgement that we’re making predictions based on crucial conditional assumptions which we can’t directly manipulate and almost certainly won’t transpire exactly the same in reality (e.g. CO2 concentration trajectory), with the result that we don’t expect even a perfect climate model to match future observational data. With that acknowledged the goal then becomes to produce a range of predictions based on a plausible set of differing conditional assumptions. This setup provides a likely range of outcomes for those working on adaptation, and, for those engaged in mitigation attempts, an idea of what would be needed to avoid given levels of change in the climate system, or particular climate impacts.

    You seem to be arguing that more sophisticated political/social/economic models could be used to narrow down a realistic “most likely” scenario to provide a better constraint, rather than assuming various scenarios to be equally plausible (?) This would be interesting and useful if true, but it seems hard to believe that such predictions could have much power over the centennial scale of interest (looking back over the 20th Century’s mass of practically unforseeable and hugely consequential events). Over the near-term maybe, but then there is very little near-term difference in the range of climate projections anyway – natural variability and persistence from past forcing is dominant.

    There is always room for improvement though. Do you have any links to better describe what you’re trying to suggest?

  6. MIT has probabilistic forecasts of population, economic activity, energy use, and related emissions, based on a model fitted to some 50 years of data.

    The relative likelihood of other scenarios immediately follows.

    You may object that 50 years of observations is not enough to forecast 100 years, which is why others are now pushing the calibration period back to 1800.

  7. Your title, “Possible futures” suggests that you and others are describing the range of futures that are compatible with the known physics and chemistry of the atmosphere. To me, at least, that implies an ensemble of models that systematically explores the uncertainty in the parameters used by models. (It also implies enough runs with different starting points to deal with the problem of chaos.) However, the results you show from AR4 are described therein as “an ensemble of opportunity” not designed to systematically explore possible futures. Your post should be called “Selected Possible Futures”. As best I can tell from Stainforth’s 2005 Nature paper and some later papers, there is a large difference between “Selected Possible Futures” and “[All] Possible Futures”. (It will be interesting to see how AR5 addresses this problem.)

    The move from emission scenarios to representative concentration pathways is another method of selecting some possible futures from [all] possible futures consistent with given emissions scenario. Given our understanding of the carbon cycle and other other factors controlling the lifetime of GHGs in the atmosphere, we project a RANGE of GHG concentrations that will accumulate in the atmosphere. To accurately project [All] Possible Futures for a given emissions scenario, that range of GHG concentrations needs to be one of the variables explored by an ensemble of models.

    With this kind of scientific sloppiness, it’s not a surprise that we have policymakers and activists running around saying the we must reduce CO2 emissions by 80% to keep the temperature from rising “more than 2 degC”. Even if one accepted the IPCC’s 2.0-4.5 degC estimate for climate sensitivity (which seems unreasonably narrow), climate scientists should be saying that we need to reduce emissions by X% – Y%. Which brings us to another problem, since they are referring keeping global temperature from rising “more than 2 degC” above “pre-industrial” temperature, and there is significant uncertainty as to what “pre-industrial temperature” was. As best I can tell, pre-industrial temperature means temperature from the LIA. A sensible reference point might be a 30-year period for which we have accurate records and concerns about both future warming and cooling (hinting at an optimum). That would be 1950-1980 for me. How much above “pre-industrial” was 1950-1980?

    As someone who once titled her blog, “All Models Are Wrong”, don’t you find this suppression of uncertainty embarrassing? Or is my interpretation of this situation flawed?

  8. I believe no researcher is paid to investigate all ranges of possibilities, rather to find out for Governments what scenarios would be policy relevant, ie. would need politicians to do something

  9. Funding and publication in prestigious journals may depend on policy relevance, but researcher is expected to report the results of his scientific investigation whether or not those results are “policy-relevant”. (See Feynman’s Cargo Cult Science p12 column 2 on “being used” by politicians.) The scientist doesn’t decide if the results are “policy relevant”, the policymaker does.

    If scientists say climate sensitivity is about 3, they can recommend that policymakers need to reduce emissions about 80%, if they want to limit future temperature to a certain amount (2 degC minus the unspecified warming that has already occurred). If scientists admit that climate sensitivity is 2-4.5, they must recommend a range of reductions, perhaps 50-110%. (The latter figure would mean that “committed warming” will exceed the 2 degC limit if climate sensitivity on the high side too high. See 350.org) If scientists admit that climate sensitivity could be anywhere between 1 and 6, then the recommended range of reductions might be 0% to 150%. As the range of required reductions widens, the scientific recommendation becomes less and less policy-prescriptive, but not less and less policy-relevant. By suppressing uncertainty, scientists appear to be encouraging policymakers to “buy insurance” against the possibility that climate sensitivity could be 3 or higher. In other words, they are imposing their ivory-tower judgment about how policymakers should spend taxpayer’s money.

  10. Frank – this is not the best of all possible worlds. Researchers are paid to be policy-relevant, and they will be policy-relevant.

    Nobody with any money to spend cares about fundamental climate research. It’s all about projections, models, mitigation, adaptation, the works.

  11. MM: How can policymakers decide what to do if they don’t understand the full RANGE of possibilities that are consistent with our BEST scientific understand of the situation?

    Suppose you have data that is auto-correlated and policy-makers need to know what the linear trend is? Do you perform a least-squares fit – ignoring the autocorrelation – so that you can report a trend with a narrow confidence interval that is useful to policymakers? Or do you correct for autocorrelation and provide them a trend with a confidence interval that is too wide to prescribe a particular policy? Or do you simply report the trend with no confidence interval? Does your answer change if you strongly prefer or oppose the policy that the trend suggests?

    As best I can tell, when the IPCC ignores the uncertainty in the parameters used by their ensemble of models, they are ignoring an important source of uncertainty somewhat equivalent to ignoring auto-correlation. Our host is an expert in ensembles and perhaps she can convince me that this problem is relatively trivial, perhaps equivalent to ignoring a minor amount of auto-correlation.

    I agree with you that many people want to do policy-relevant or policy-prescriptive research. That is exactly what has brought us to the current “pause” in warming – where people are beginning to realize that the IPCC consensus could be significantly wrong. Is the problem underestimation of natural variation or over-estimation of climate sensitivity? The answer is critical, but – once a area of science has lost is credibility – policymakers probably won’t be listening when they finally figure it out.

Leave a Reply

Your email address will not be published. Required fields are marked *


Add your ORCID here. (e.g. 0000-0002-7299-680X)

Back to top